Like last week, I didn’t get an awful lot of time to work on the game. I only got about 4 hours of work done on it, which basically amounted to loading my lecture theatre map into my engine and debugging it.
So this week, I am going to take the opportunity to talk about something slightly different. Something I don’t see talked about nearly as much as it should be is the importance of a graphics debugger! Be warned: things are going to be a little more technical this week.
Why Should You Use a Debugger?
Let’s start by talking about a normal debugger. If you have never really used a debugger or know what a debugger is, you may be wondering what the point is. For a lot of people, debugging consists of just scattering print statements around the codebase and building up a log. The problem with this method is that it can get very tiring and tedious when trying to find a specific bug that could be affected by lots of different things.
A few weeks ago I had a bug with my collision where I was colliding with the edges of geometry but not the triangular faces. The following is the bit of C# code for checking whether a point is inside a triangle:
var pa = Vertex0 * scale;
var pb = Vertex1 * scale;
var pc = Vertex2 * scale;

var e10 = pb - pa;
var e20 = pc - pa;

float a = Vector3.Dot(e10, e10);
float b = Vector3.Dot(e10, e20);
float c = Vector3.Dot(e20, e20);
float acBb = (a * c) - (b * b);
var vp = point - pa;

float d = Vector3.Dot(vp, e10);
float e = Vector3.Dot(vp, e20);
float x = (d * c) - (e * b);
float y = (e * a) - (d * b);
float z = x + y - acBb;

uint ux = (uint)x;
uint uy = (uint)y;
uint uz = (uint)z;

return (uz & ~(ux | uy) & 0x80000000) > 0;Can you spot the bug in it? I would be very impressed if you could. Debugging this bit of code with print statements would also be a real pain. Since we have no idea which line of code is broken, we would have to insert print statements for every single line! Not only that, but variables like vp are vectors, so we would need to see all of its x, y, z values.
This by my standards is horribly tedious and where a debugger should be used. I am personally using Visual Studio Community for writing my C# code which comes with an exceptionally good C# CPU debugger. Instead of printing everything out, you can simply add watches for each variable and shove a breakpoint in at the end of the method. This is only a very small part of what this debugger (or any debugger really) can do, and it is well worth reading up on the debugging features of whatever software you are using. For Visual Studio, you can find all the information here.
For those interested, the bug was an integer overflow in ux, uy and uz. I fixed this by centering the triangle and the point at the world origin and using ulong instead of uint. I also inserted a sanity check to make sure I get an error if we somehow still overflow.
The Problems of Graphics Debugging
So that was an explanation on why you should use a debugger in general, but that only works for CPU code. Graphics debugging is more of a special case since your code is running on the GPU instead. The problem with this is that unlike CPU code, GPU code runs in data parallel. This means there could be thousands of threads running the code at any one time which makes it virtually impossible to find offending threads.
Libraries like CUDA solve this problem by running your code on the CPU when debugging. There are options similar to this if you are debugging DirectX applications (see: NVIDIA Nsight Aftermath) but the only option available for OpenGL line-by-line debugging is glsl-debugger which is HORRIBLY outdated. It only works up to GLSL 1.2 which came out just over 14 years ago! No one should be using that beyond maintainers of old code!
If that wasn’t bad enough, your choice of graphics debugger is also limited by what graphics card you have. Got an AMD graphics card? Sorry, but you can’t use NVIDIA Nsight and you will have to use GPU PerfStudio instead.
This is all pretty terrible and would scare anyone off trying to figure out how to debug their graphics code. So let me try and convince you as to why you absolutely should still persevere.
Why Should You Use a Graphics Debugger?
While working on my game this week, I came across a really weird graphical glitch when I imported my lecture theatre scene into my engine. Words don’t do it justice, so have an image.
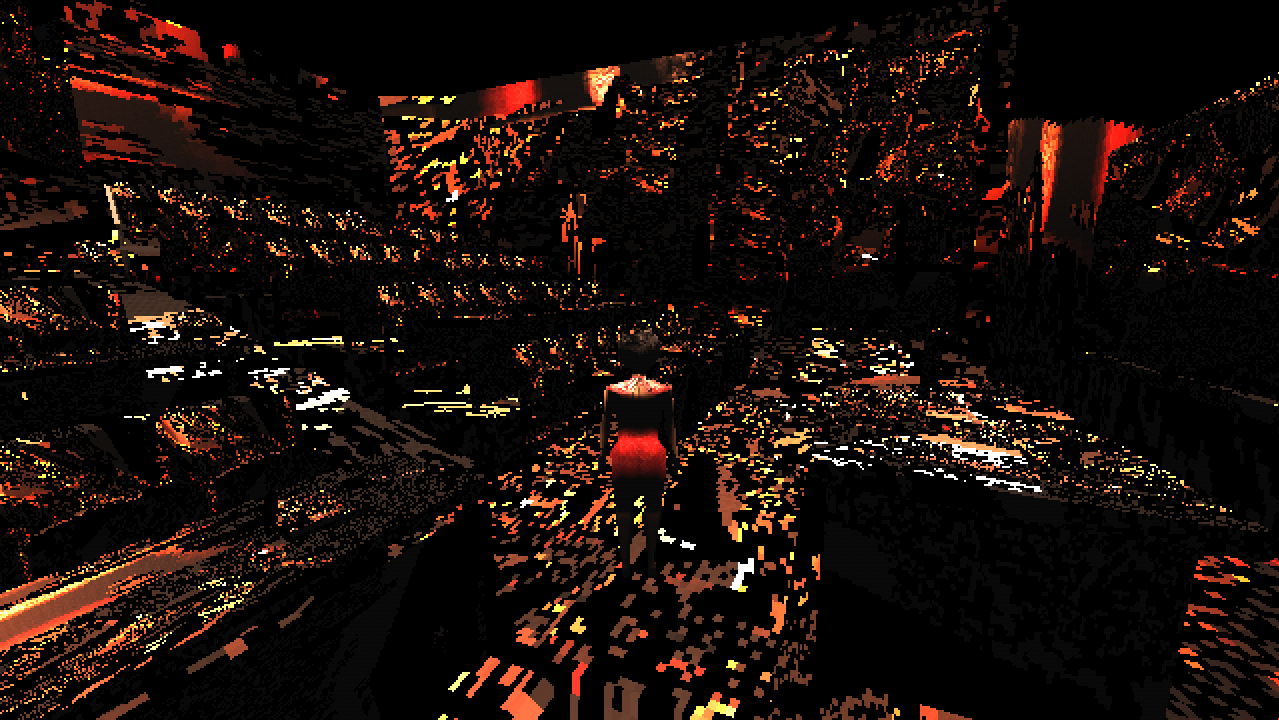
If you look closely (particularly at the back wall) you can actually see my main character plastered about the place. I guessed that somehow I was drawing the screen back onto the geometry but I had no idea why. Enter RenderDoc!
RenderDoc is a wonderful, cross-platform tool that allows you to capture the current frame and inspect everything that happened graphically in that frame. This means that it doesn’t look at the code directly (so no line-by-line debugging of shaders) but it helps to massively demystify what is happening on the GPU. It contains a timeline of all the GPU calls made during the frame, shows the contents of buffers and uniforms and much more. Working without RenderDoc means lots of guesswork and blindly researching all the graphics calls you make to see if one of them might be doing something unexpected. I suffered for a long time by not using RenderDoc, and although I did learn a heck of a lot about OpenGL in the process, I can’t help but feel I might have learned a lot faster if I was using RenderDoc at the same time.
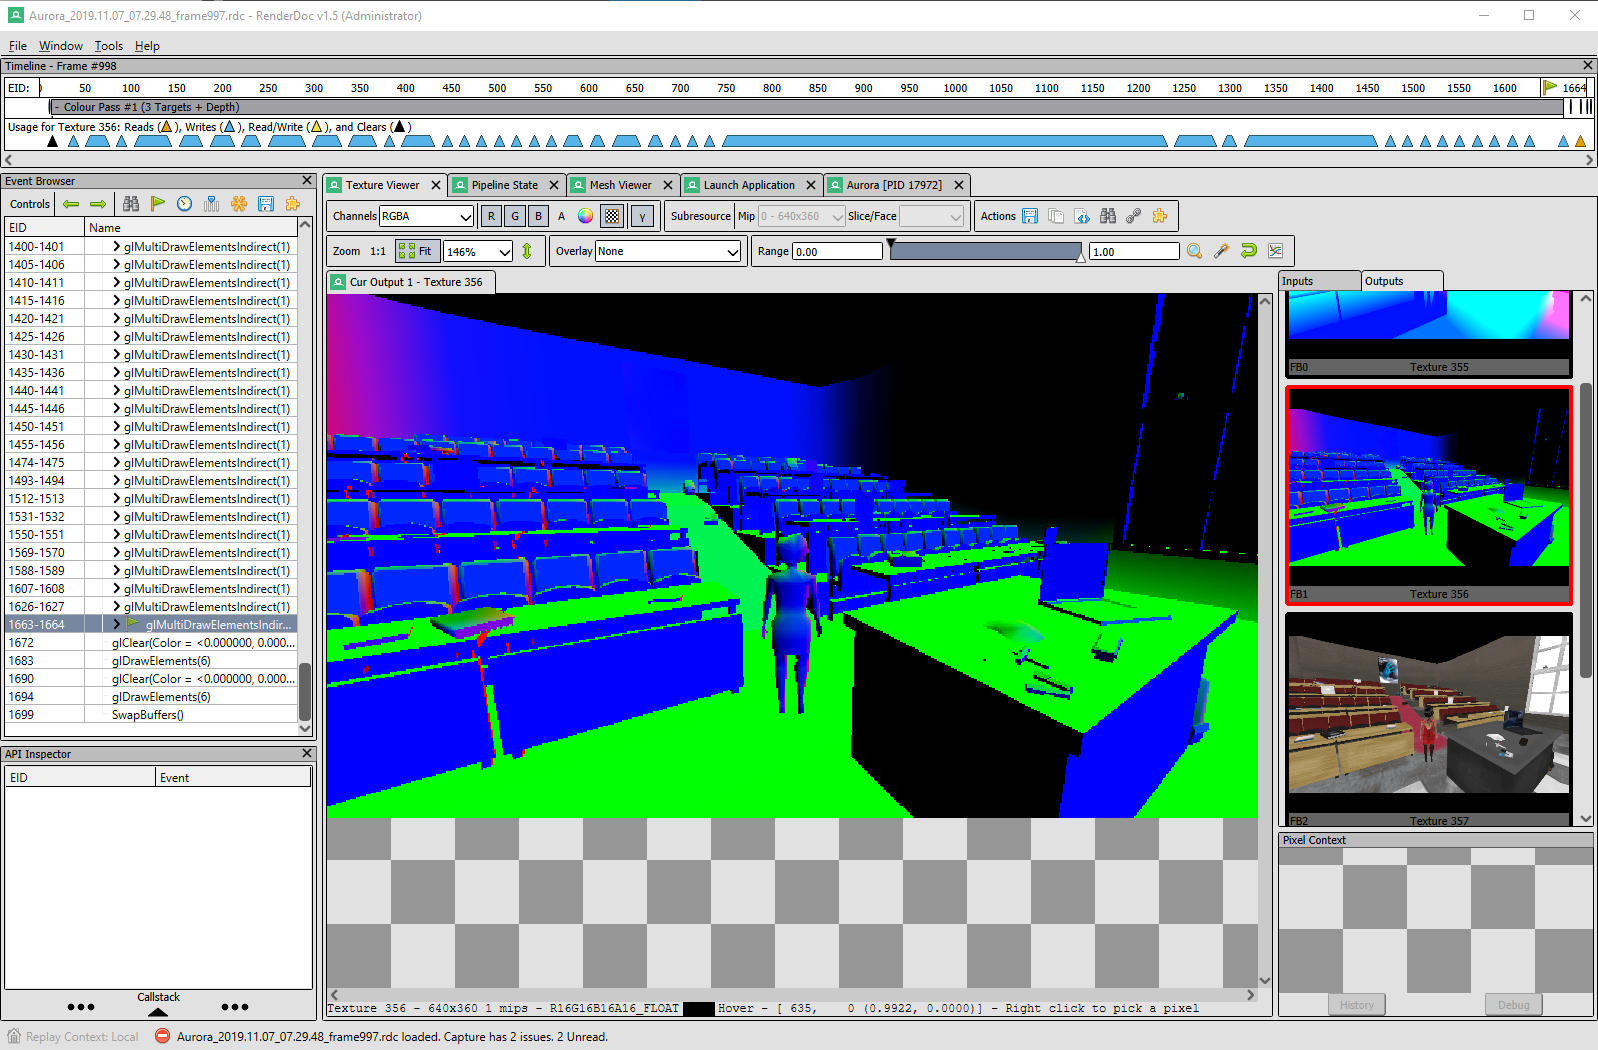
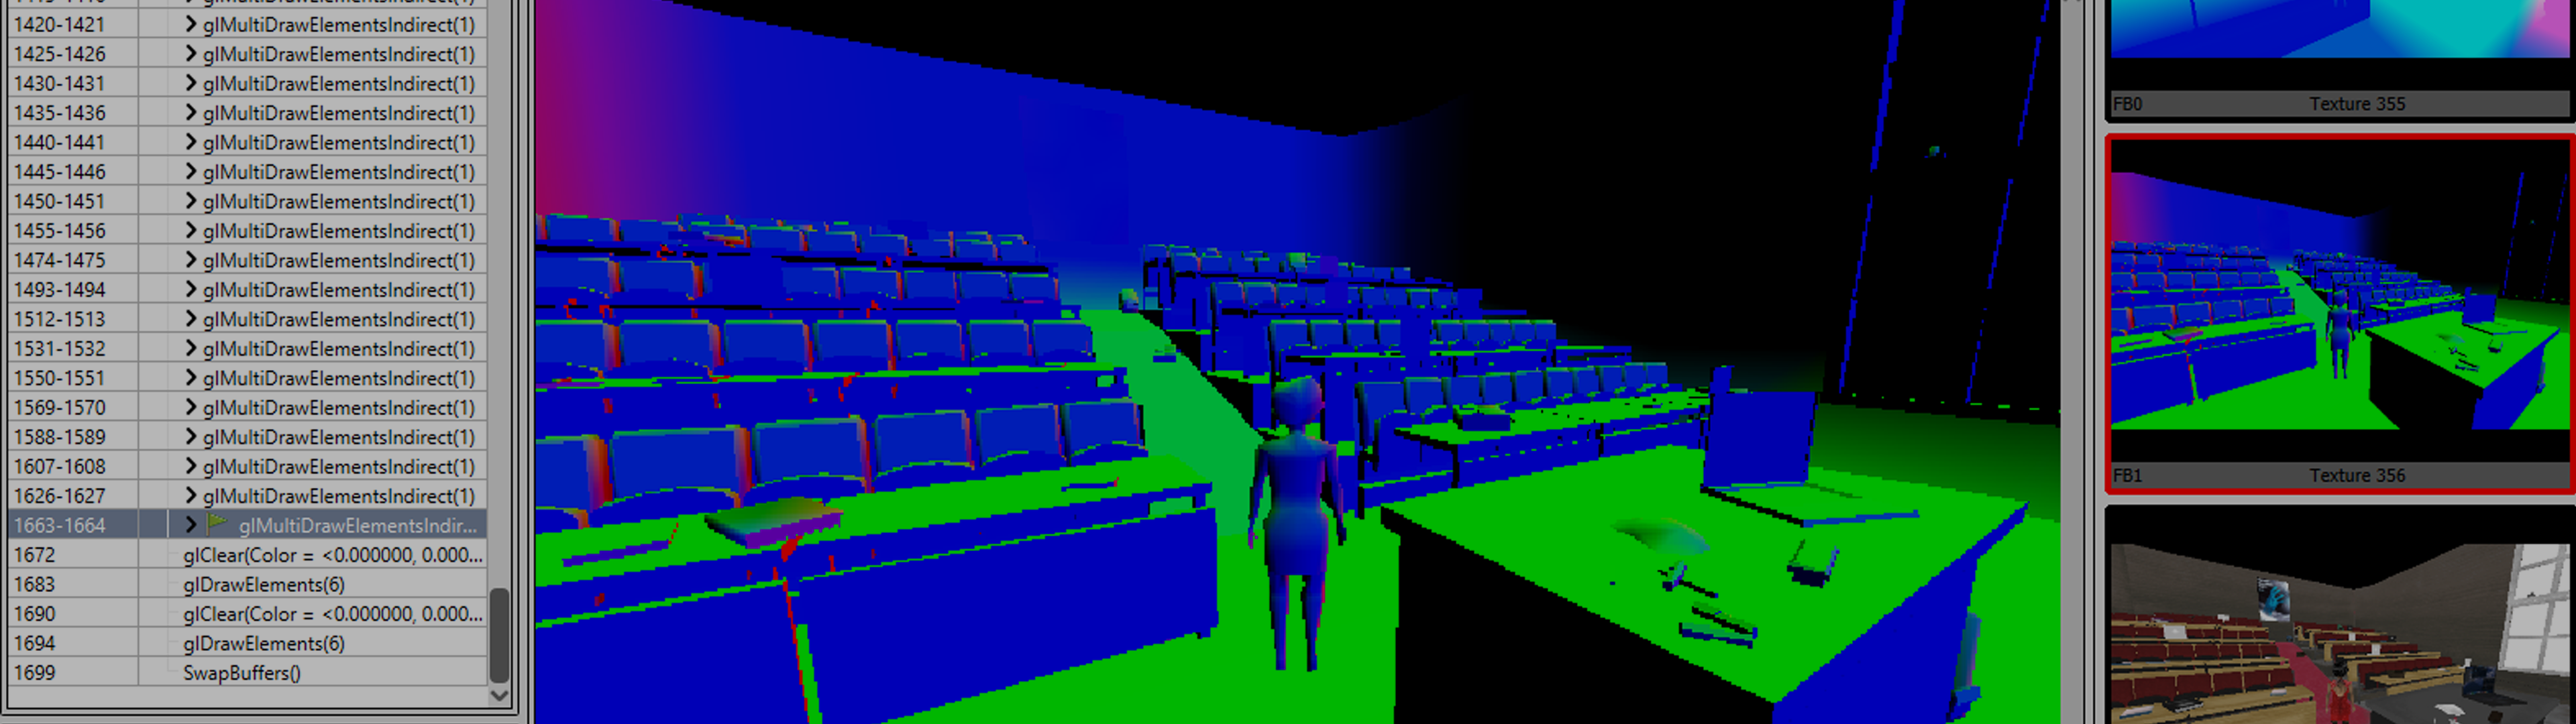
So how did RenderDoc help me in this particular instance? Easy! I scanned the timeline and checked each render call (for me, that was glMultiDrawElementsIndirect) and noticed that for every single call the front buffer texture was being bound as each object’s texture instead of their specific textures. For instance a book should have had a book texture but instead it had the entire image that was being shown on screen last frame.
This was only a small part of RenderDoc, but if you have ever done graphics programming or are interested in it you can hopefully recognise how helpful it could be.
Next Week
So that’s about it for my explanation of RenderDoc. This was a fun little aside to talking specifically about my game development and in future I might talk about other subjects if it has been a slow week. This week I am going to be improving things graphically by aiming to add a skybox, proper specular highlights and if I manage it; shadows.